• 1 Post
  • 4 Comments
Joined 2 years ago
cake
Cake day: August 10th, 2023

help-circle
  • It is using Glance extension module (you can send custom HTML by setting up a local web api like Flask) The graph are HTML SVG tags which are basic drawing you just have to input the x,y coordinates of your graph (I copied Glance market chart) For networking data collection and monitoring I’ve setup my own rules and scripts but it is doable with others network monitoring tools if they let you access data easily


  • Yes the full recipe is:

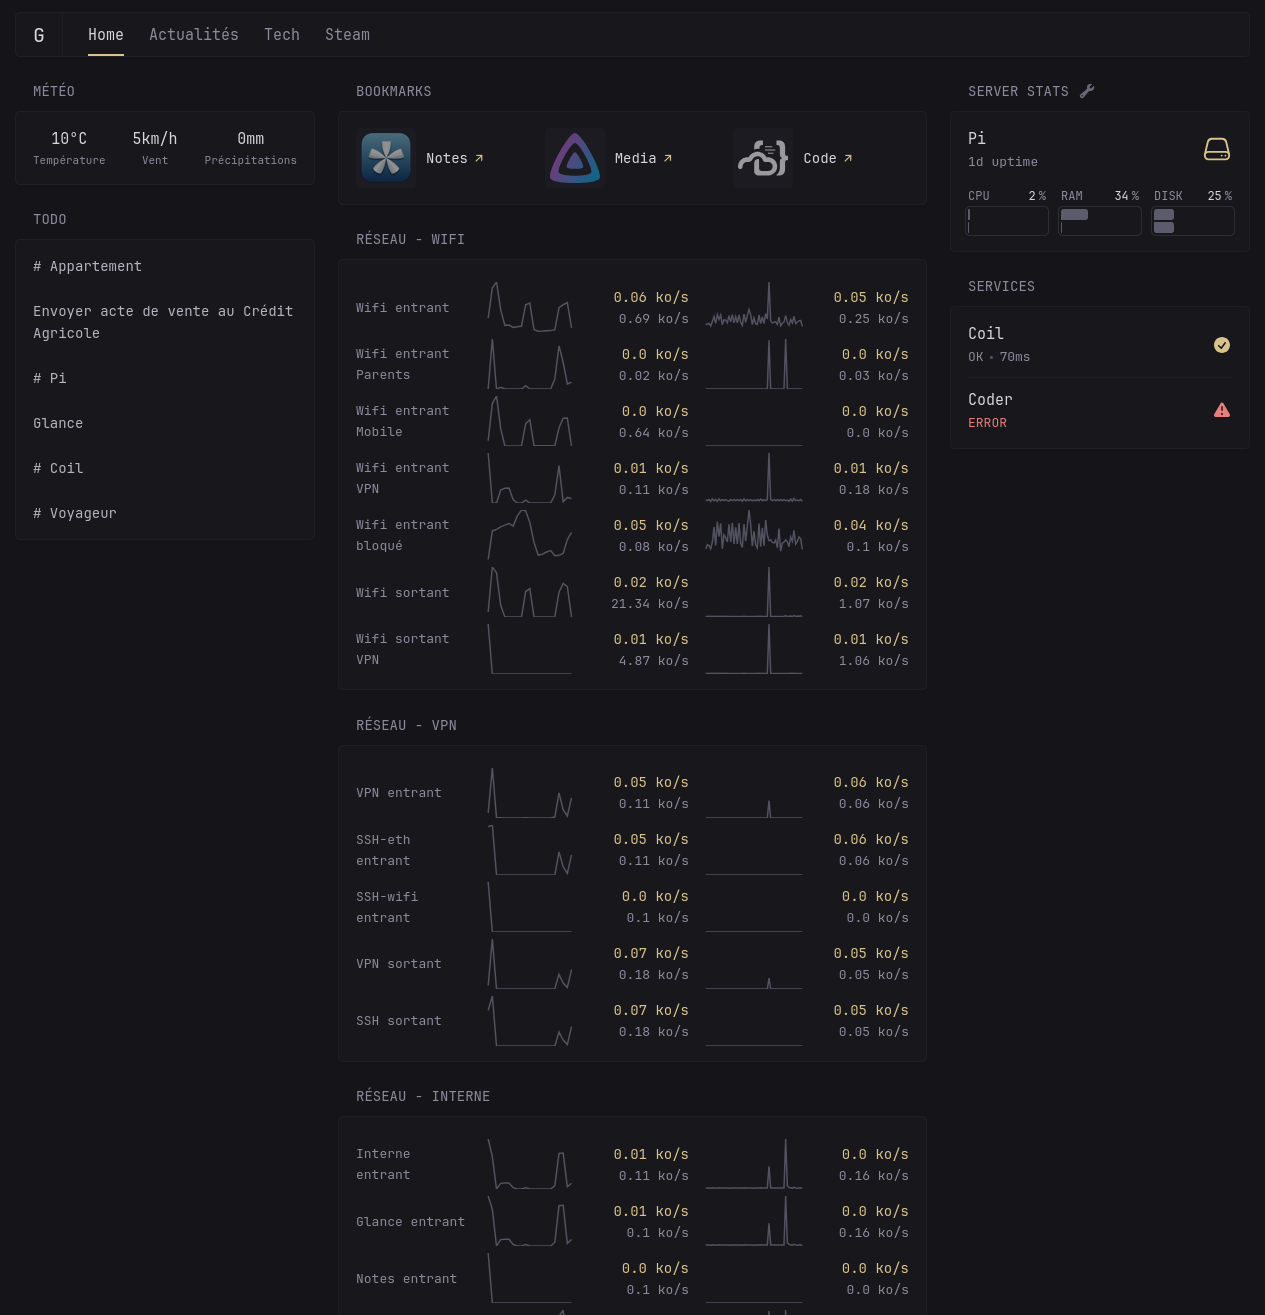
    • 1 Flask API for sending custom HTML to Glance
    • 1 systemd unit + python script for the right graph (last 60 minutes, resetting counter and collecting data via nftables python module)
    • 1 systemd unit + python script for the left graph (last 24h, aggregate data from the last hour collevted by the first script And that’s it, the systemd units are used to schedule python scripts and all the data are stored in flat csv file (forgot one bash script +systemd unit to to flush docker rules at boot and apply custom ones)

  • Glance is cool I love the style and it is well implemented so you can easily add custom HTML and CSS which is what I did to do this custom monitoring. Data are gathered from iptables counters that periodically reset, the hardest and most interesting part was to understand networking and to track packet through applications based on if they were port binded or reverse proxyed (I use Caddy for web facing app I want access to without a VPN). I’ll definitively check more advanced solution, I just needed to do it manually first to actually understand what I’m doing (which took me like 2 weeks until I finally found this gem on ArchLinux wiki https://www.frozentux.net/iptables-tutorial/iptables-tutorial.html)


  • I just went done this road and i’d say it is worth it even only for the learning part. I’ve set counter per application in nftable, and via a python script send them in SVG graph format to Glance dashboard. The result is I can monitor my whole network per application and the best part it all add up very well so I know there is no ‘unknown’ outgoing or ingoing traffic on my machine.