
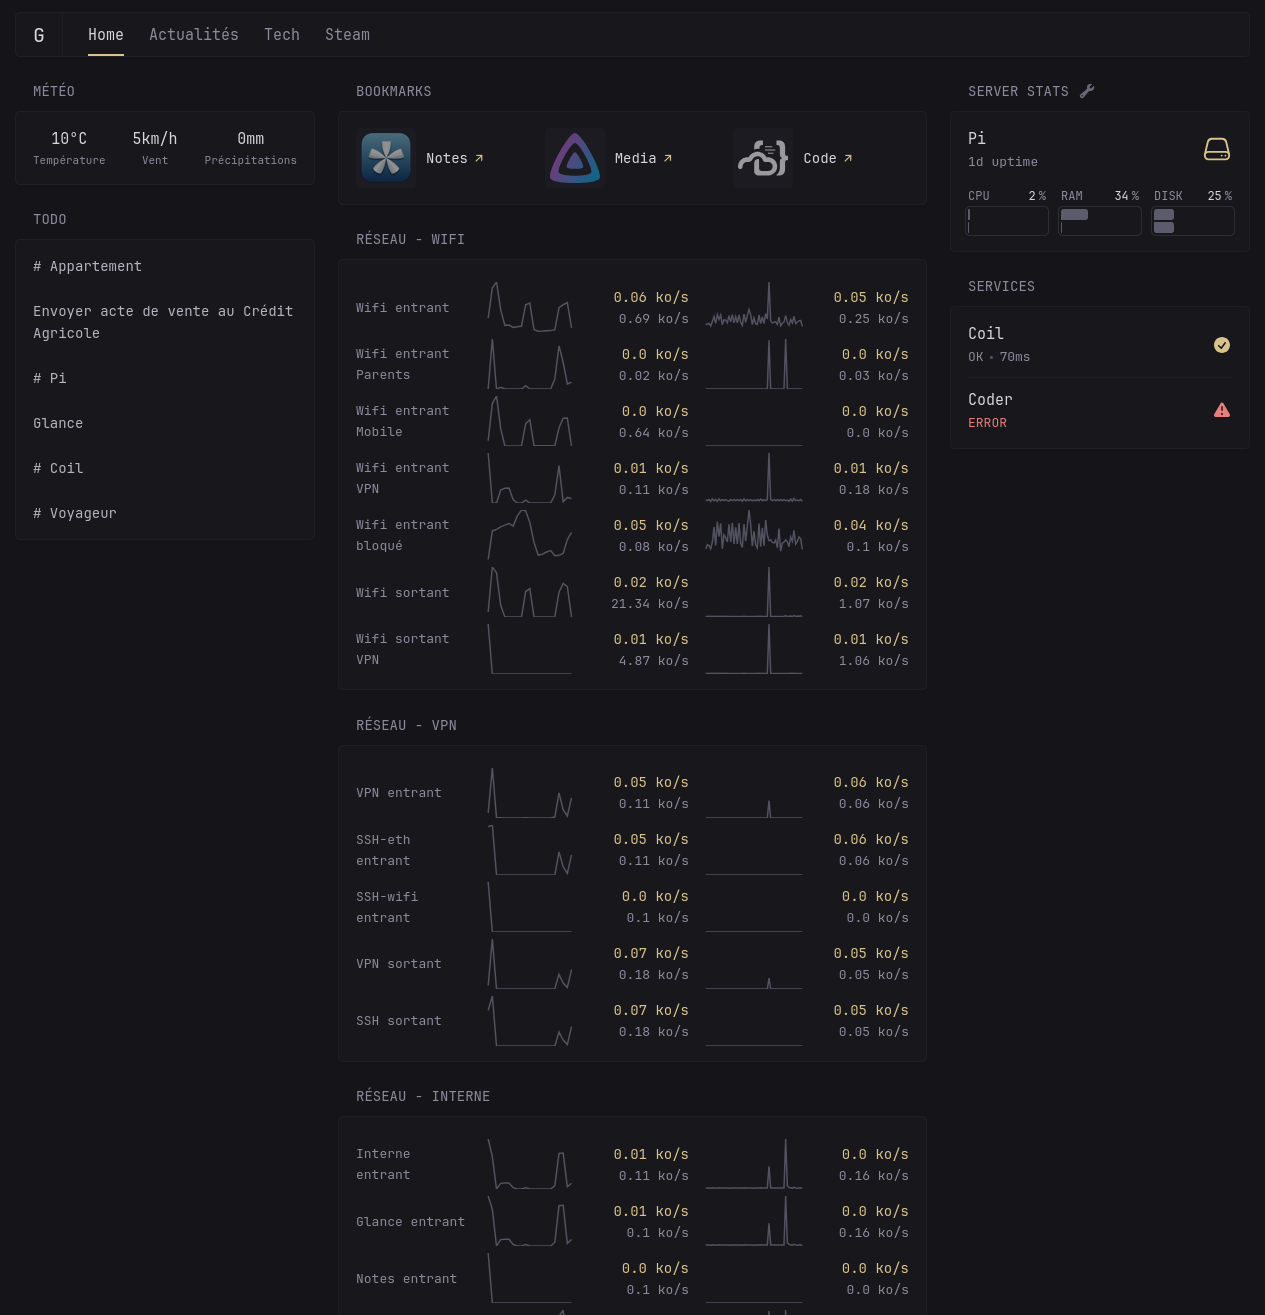
I spent some time learning and configuring my firewall, then displayed it in form of SVG graph on Glance. I’m pretty happy about the result so I wanted to share it :)
I spent some time learning and configuring my firewall, then displayed it in form of SVG graph on Glance. I’m pretty happy about the result so I wanted to share it :)
Just been at it myself setting up my config for glance with custom css theme. Would love to compare notes, how did you get those network graphs going?
It is using Glance extension module (you can send custom HTML by setting up a local web api like Flask) The graph are HTML SVG tags which are basic drawing you just have to input the x,y coordinates of your graph (I copied Glance market chart) For networking data collection and monitoring I’ve setup my own rules and scripts but it is doable with others network monitoring tools if they let you access data easily